Page 1111 of 2985
Re: Financial topics
Posted: Sun Jun 08, 2014 12:08 pm
by Higgenbotham
In the past, humans could tear down a city and rebuild it to a better standard. Today, for the first time, that is not possible, though it may be in the future with a new and more powerful form of energy. If there's a war and our cities are destroyed, they may never come back. It took huge amounts of cheap oil to build our modern day cities and that oil is gone. During the last great war, oil discoveries and production were on the ascent and it was very easy to rebuild cities and populations. World leaders may hesitate to destroy what is in their backyard for this reason, but not hesitate to destroy what is far away. Eventually it may all be destroyed anyway, regardless of the hesitation, as that is human nature during the descent phase.
Re: Financial topics
Posted: Mon Jun 09, 2014 12:22 am
by Higgenbotham
I talked about the mirroring effect a few months back. First in this post I will put up the 2014 high so far and the 2008/2009 low. In the next post I will show one diagram that will have the 2014 high so far on top and the 2008/2009 low flipped vertically.

- TOP.gif (36.02 KiB) Viewed 7493 times

- BOTTOM.gif (33.67 KiB) Viewed 7493 times
Re: Financial topics
Posted: Mon Jun 09, 2014 12:25 am
by Higgenbotham
Higgenbotham wrote:Speaking of the extremes at the highs and lows, I had mentioned the mirroring effect a few weeks back that was seen between the major lows and highs. The 2008 and 2009 lows are separated by 105 days between November 21, 2008 and March 6, 2009. 105 days from the high at September 19, 2013 is January 2, 2014. This relationship has worked from time to time; for example from the November 5, 2010 high to the February 18, 2011 high was 105 days, and from the January 19, 2010 high to the test of the April 26, 2010 high which occurred on May 3 was 104 days. The late Terry Laundry had also found this effect and called it the ringing cycle. The distance between the lows at the bear market bottom seems to set up a resonance that takes effect throughout the move back to the next top.

- Untitled.jpg (140.2 KiB) Viewed 7493 times
Whether this will work or not this time around is hard to say because there have been so many cycles already where it appeared the market would make a mirroring top and then it recycled back into higher prices. Though I would say this is the best pattern match so far, by far, where the polarity of the herd has inverted pretty darn close to what was seen at the 2008/2009 bottom.
Re: Financial topics
Posted: Mon Jun 09, 2014 12:52 am
by Higgenbotham
Higgenbotham wrote:The time period from February 27, 2010 through May 6, 2010 is a mirror image of the time period from May 2, 2011 through July 7, 2011 (the first time period is 68 days and the second is 66 days).
I had noticed the above but just did an actual 180 degree turn and flip of the time period before and including the flash crash and our recent time period and put them side by side. The resemblance is extraordinary and indicates the polarity shift of the herd right on the specified time sequence.
Herd changes polarity. Top image is mirror image of flash crash. Bottom image is most recent market activity. This activity is separated by 14 months, as is the March 6, 2009 low and the May 6, 2010 flash crash.
The above was posted here July 7, 2011. This one did work, where it found the July 7, 2011 top. Unfortunately the image is no longer available. Will see if I can dig it out of my files and repost it. The top image is February 27, 2010 to May 6, 2010 flipped vertically. The bottom image is May 2, 2011 to July 7, 2011.

- herd1.jpg (11.13 KiB) Viewed 7491 times
Re: Financial topics
Posted: Mon Jun 09, 2014 6:41 am
by aedens
gigo
http://motherboard.vice.com/blog/why-th ... kazakhstan
When it opens in September 2015, the $102-million project laboratory is meant to serve as a Central Asian way station for a global war on dangerous disease. And as a project under that Pentagon program, the Defense Threat Reduction Agency, the lab will be built, and some of its early operation funded, by American taxpayers.
Re: Financial topics
Posted: Mon Jun 09, 2014 8:40 am
by aedens
$11 x 40hr = $440
$15 x 29hr = $435
No bennies or perkys for you since the red diapers just took over seattle.
The single payer system is a scam for the corps to gain market share and simply nothing more.
ACA Status Codes
Choose the code that best describes the employee:
Employee Type ACA Status Code Definition Employee
Y1 Anticipated to work an average of at least 130 hours per month over the next 12 months
Anticipated to work an average of less than 130 hours per month over the next 12 months
Educational Organization Employee
Y2 Anticipated to work an average of at least 130 hours per month over the next 12 months
N2 Anticipated to work an average of less than 130 hours per month over the next 12 months
Seasonal Employee
Y3 Anticipated to work an average of at least 130 hours per month over the next 12 months
N3 Anticipated to work an average of less than 130 hours per month over the next 12 months
Re: Financial topics
Posted: Mon Jun 09, 2014 11:24 am
by aedens
Not to far from the july 28th window as noted earlier h.
https://solarcycles.files.wordpress.com ... 1937cr.gif
g19 thread is my context on this window upcoming.
http://www.federalreserve.gov/releases/ ... nt/#table1
http://www.federalreserve.gov/datadownl ... &pp=Format
Exhaustion leg
http://gdxforum.com/forum/viewtopic.php ... 1937#p4040
I'm convinced they can keep this ball of fiat shit in the air for longer than any bear has imagined...
but when it breaks it's going to be mind blowing... t
Re: Financial topics
Posted: Mon Jun 09, 2014 9:51 pm
by Higgenbotham
aedens wrote:g19 thread is my context on this window upcoming.
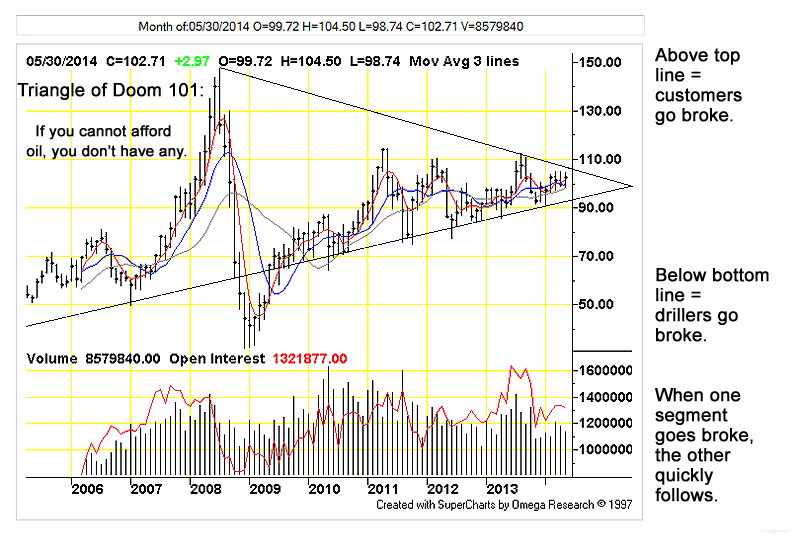
Oil is close to $105 tonight so not sure the 1937 or 1973 scenarios can be held off much longer. The rise in oil prices capped the 1973, 2008, and 2011 rallies and this is starting to look familiar - weak economy, rising oil, and perhaps the "triangle of doom" hitting right here.
aedens wrote:I'm convinced they can keep this ball of fiat shit in the air for longer than any bear has imagined...
but when it breaks it's going to be mind blowing... t
I see all bulls and no bears left to imagine anything, except former bears imagining higher prices.
I'm with you now, a, took a permanent 10% short that will not be touched. Then will add on the way down if it starts to give way; as t said, when it breaks it will take no prisoners.
Re: Financial topics
Posted: Mon Jun 09, 2014 9:57 pm
by Higgenbotham
Triangle of Doom
http://www.economic-undertow.com/wp-con ... 060114.png
http://www.economic-undertow.com/2014/0 ... g-of-doom/
- CL_74.gif (19.96 KiB) Viewed 7447 times
For those who haven't heard of this concept, it means the oil price has been moving to the tip of the triangle he shows for the reason that there is a finer and finer balance between what consumers can afford to pay as they become poorer in the aggregate and what oil producers must receive in the aggregate as oil extraction becomes more difficult and the cost to produce oil escalates. There is an explanation of this on the right side of his chart (first link). Today there was a sudden move higher in the oil price.
Re: Financial topics
Posted: Mon Jun 09, 2014 10:51 pm
by Higgenbotham
Crude oil and stock prices at the 2011 high

- CRUDE2011.png (9.56 KiB) Viewed 7447 times
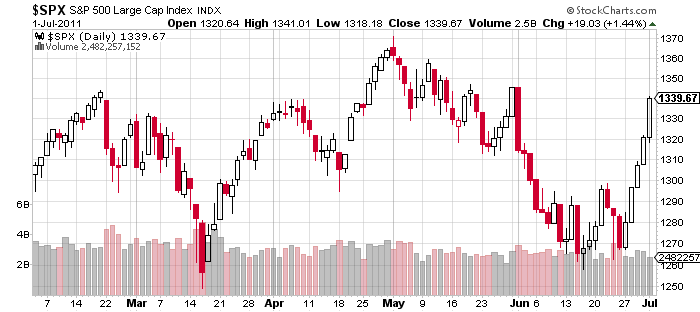
- SPX2011.png (9.37 KiB) Viewed 7447 times