Financial topics

Investments, gold, currencies, surviving after a financial meltdown
Higgenbotham
Posts: 7985
Joined: Wed Sep 24, 2008 11:28 pm

Re: Financial topics

Post by Higgenbotham »

aedens wrote:I cannot see the G.19 moving down can you? http://www.federalreserve.gov/releases/g19/ data to wit or nor can they since we all know the Consumers vigor. I still feel we are farther along on terms of mid seventy pain still. Key work is serious dialog and it will have to precise without the Wall Street trade blowback since many indeed should be pink slipped anyway or on the docket. This goes beyond moral hazard given the dollar index looming since if it drops we seen the correlation to fuel which will annilate million of consumers since there sacred CPI worship will be more than crushed. What is the spark for the massive internal combustion to be unleased. We already know that amplitude wave. Debased Money is debased people until total collapse. These idiots never get it and far to many new it was coming anyway.
Another spike in fuel prices sounds ominous and as we've been saying "nothing has been learned in the past 2 years" so why would it surprise us. It probably wouldn't have to go back to $4 as the consumer is more fragile than 2 years ago. What would it take - $3, $3.50?

Also, if one is looking for a 1970's analog to the stock market reaction to a fuel price spike, the October 1973 pattern at the high shows similarity to the last 32 days of price action.

http://theoptiontrader.com/History-Char ... harts.aspx

aedens, look at this final run in the Dow from the 875 low in 1973, then compare to the run in the S&P this year from 875. The pattern looks identical, number of days, everything. You may be onto something about these fuel prices and some sort of repeat of the 1970's.

1973 was 36 years ago and 36 years before that in 1937 a similar looking run ended on August 15, 1937. A little history on that. I know a guy was was 22 years old at that time. He has repeatedly told me a story about seeing a headline in 1937 in the Chicago Tribune that was 2 inches high proclaiming "THERE IS LIGHT AT THE END OF THE TUNNEL", then he tells me that right after he saw that headline stocks plunged. He's told me that story at least a dozen times. Made a big impact on him.

Also, 36 years before that, in 1901, stocks made a secondary high in August, then plunged.
Last edited by Higgenbotham on Sun Aug 23, 2009 9:46 am, edited 1 time in total.
While the periphery breaks down rather slowly at first, the capital cities of the hegemon should collapse suddenly and violently.
John
Posts: 11501
Joined: Sat Sep 20, 2008 12:10 pm
Location: Cambridge, MA USA
Contact:

Re: Financial topics

Post by John »

A web site reader asks about historical data on book value:
Web site reader wrote: > I just found your website this morning and it is very well done. I
> am putting together spread sheets analyzing different market
> trends. When I started looking at the book values you have it
> looks like you calculated it using a CAGR of 4.86%. If you look at
> the DJIA official website the price to book ratio as of July 31,
> 2009 with an index value of 9,171.61 is 2.55 giving it an implied
> book value of 3,596.71. Just wondering if you have access to more
> precise historical book values for the DJIA - I cannot seem to
> find any historical data.
Shiller's data has dividends and earnings, but not book values.
http://www.econ.yale.edu/~shiller/data.htm

Any ideas?

John
John
Posts: 11501
Joined: Sat Sep 20, 2008 12:10 pm
Location: Cambridge, MA USA
Contact:

8/21/2009 P/E ratios from Wall Street Journal

Post by John »

-- 8/21/2009 P/E ratios from Wall Street Journal

Here are the latest P/E ratios from the Wall Street Journals:

Dow Industrial 15.34
Dow Transportation 4568.06
Dow Utility 12.04

Nasdaq Composite 42.02
Russell 2000 nil
S&P 500 68.26

All are based on trailing 12 months of as-reported earnings.
Sources: Birinyi Associates, WSJ Market Data Group

http://online.wsj.com/mdc/public/page/2 ... nav_2_3002


WSJ has completely given up on "operating earnings." It may be a
fantasy, but I like to think that it was pressure from freddyv and
this web site that caused WSJ to change its policy.

I don't really know where the 68.26 figure comes from. Still, it's a
lot more honest then the ridiculous figures of 12 or 13 or 14 that I
hear on CNBC and Bloomberg TV.

It's interesting that the Dow Industrials P/E ratio is 15.34. I have
no idea whether to believe that figure, given all the dishonesty
that's gone by in the past. Perhaps it's because the bailouts have
particularly targeted the 30 Dow Industrial companies. On the other
hand, the Dow Transportation P/E is up to 4568, so perhaps it all
just balances out to the 68.26 of the S&P 500 P/E index.

John
John
Posts: 11501
Joined: Sat Sep 20, 2008 12:10 pm
Location: Cambridge, MA USA
Contact:

8/21/2009 P/E ratios from Decision Point

Post by John »

-- 8/21/2009 P/E ratios from Decision Point

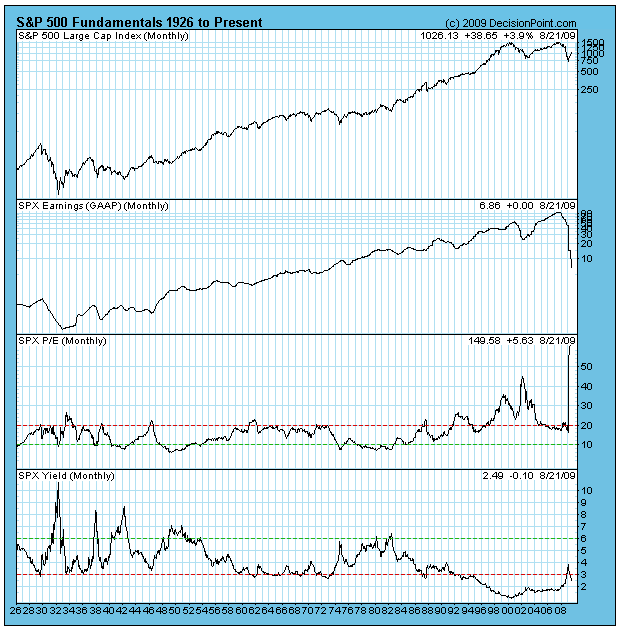
Here is the latest chart from Decision Point:

Image

http://www.decisionpoint.com/TAC/SWENLIN.html

This chart is a refutation of the "green shoots" theory.

The S&P 500 index is a near historic all-time highs.

But GAAP ("as reported") earnings have fallen to the levels of the mid
1970s.

And P/E ratios have gone off the charts.

John
John
Posts: 11501
Joined: Sat Sep 20, 2008 12:10 pm
Location: Cambridge, MA USA
Contact:

Matt Stiles: Short Interest Ratio and "Maximum Frustration"

Post by John »

-- Matt Stiles: Short Interest Ratio and "Maximum Frustration"

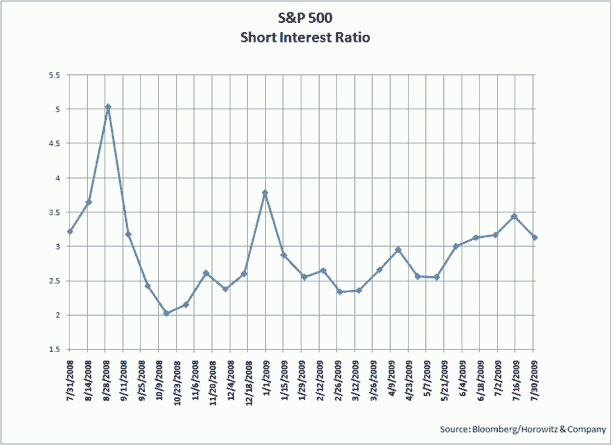
Matt Stiles' Futronics blog says that the recent fall in the "Short
Interest Ratio" indicates that short sellers are getting out of the
market. He says that tend to take "the path of maximum frustration"
at major turns to "ensure that as few as possible are allowed to
benefit from another leg down in the stock market."
Matt Stiles wrote: > The major averages failed to make any kind of significant pullback
> in price. Overbought conditions can work themselves off via either
> time or price - usually, but not always, a combination of both. It
> appears that the S&P is merely taking its time moving sideways
> prior to another thrust higher. The shorts appear to be getting
> frustrated as even bad news (retail sales, consumer confidence,
> bank failures) is happily bought. The bi-weekly short interest
> report shows short interest falling in the last two weeks of July,
> even as the market rallied - consistent with the short squeeze
> thesis.

> As mentioned earlier this week, the markets tend to take "the path
> of maximum frustration" at major turns. It will be attempted to
> ensure that as few as possible are allowed to benefit from another
> leg down in the stock market. And notice how short interest is
> much lower than it was at this time last year.

> It can also be seen that there remains higher levels of short
> interest in financials and consumer discretionary stocks. I
> suppose some may be speculating that back to school sales will be
> poor. A few positive reports on that front could accompany a final
> blowoff top and yet more short squeezes.

Image
http://futronomics.blogspot.com/2009/08 ... -3109.html
For a discussion of the "short interest ratio," see
http://www.investopedia.com/articles/01/082201.asp

The above chart shows that short selling has been generally
increasing since the mid-March stock market lows (with a brief
respite in mid-May), continuing upward until mid-July, and falling
after that.

This supports the analysis by Higgenbotham and others that short
sellers are being forced out of the market by the rally, with the
expectation that this will signal the end of the rally.

John
Higgenbotham
Posts: 7985
Joined: Wed Sep 24, 2008 11:28 pm

Re: 8/21/2009 P/E ratios from Decision Point

Post by Higgenbotham »

John wrote:-- 8/21/2009 P/E ratios from Decision Point
I found this table of values for the S&P index at the Decision Point site you linked to. I believe these estimates to be reasonable because I went to the Standard and Poors web site after Q2 earnings were 85% reported and did my own "best case" estimate for the S&P Index based on the most optimistic scenario I could come up with. That would be to value the S&P on the high end of the most optimistic earnings series for 2010 and at the highest PE that would seem within reason to someone trying to make a bullish case.

My number was 774. As can be seen in the table, the Decision Point numher is 772. By contrast, Fair Value for the SPX at present is around 100. I guess I should add for anyone not familiar with this jargon that the SPX is the symbol for the Standard and Poors (S&P) 500 Index and the index is currently trading at around 1000, or about 10 times the fair value estimated in this table at the Decision Point site.

Est Est Est Est
2009 Q1 2009 Q2 2009 Q3 2009 Q4 2010 Q1
Undervalued (SPX if P/E = 10): 69 77 55 364 386
Fair Value (SPX if P/E = 15): 103 116 82 547 579
Overvalued (SPX if P/E = 20): 137 155 109 729 772

John, I believe we are in the crazy bull market that Harry Dent, etc., forecast would end around 2009. They didn't see the real estate/derivatives bubble popping first. Where would the stock market be today if that hadn't happened? I shudder to think about it. Could be Dow 40,000.
While the periphery breaks down rather slowly at first, the capital cities of the hegemon should collapse suddenly and violently.
John
Posts: 11501
Joined: Sat Sep 20, 2008 12:10 pm
Location: Cambridge, MA USA
Contact:

Falling real estate prices, rising delinquencies

Post by John »

-- Falling real estate prices, rising delinquencies

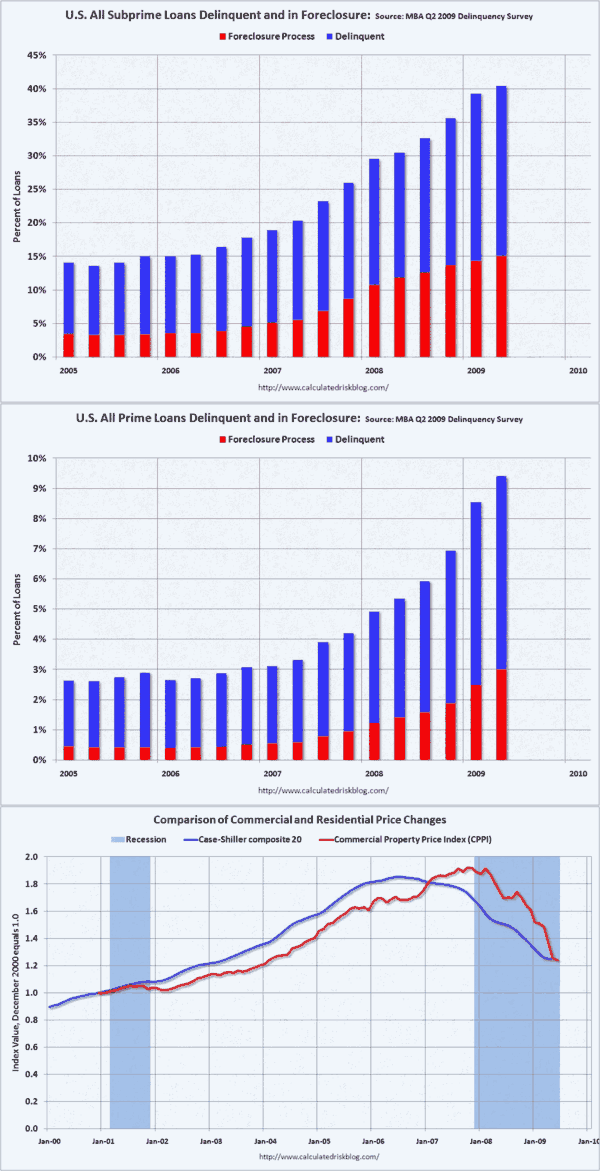
I've put together some graphics from Calculated Risk:

Image

http://www.calculatedriskblog.com/2009/ ... ak-at.html
http://www.calculatedriskblog.com/2009/ ... -from.html

The one on top shows the percentage of subprime mortgage loans in
delinquency and foreclosure. The rates are now above 40%. Some
people are calling this "good news" because it appears that the
growth is a slightly decelerating growth rate.

Even if that were true, it would still mean that the foreclosure rate
would not return to levels below 15% for at least a couple of years.
But it's also possible that the delinquency rate slowed slightly
because of all the stimulus money, and that it's poised to start up
again.

The middle graph shows the same for prime loans. These loans
historically have a foreclosure rate below 3%, but this year the
foreclosure rate has been accelerating upward.

The bottom graph shows that commercial prices falls are now catching
up to residential price falls. This has been predicted for a couple
of years, but now it's happening in full force.

So much for "green shoots."

John
wvbill
Posts: 65
Joined: Sun Oct 05, 2008 9:46 pm

I think the uprising is near.

Post by wvbill »

gerald
Posts: 1681
Joined: Sat May 02, 2009 10:34 pm

Re: Financial topics

Post by gerald »

useless observation.
http://www.abovetopsecret.com/forum/thread491187/pg1
Do I feel people are getting pissed off, or am I nuts? hope I am nuts , Because I no not want to see what happens next, if this is an indication of what is to come.
Marshall Kane
Posts: 37
Joined: Tue Oct 21, 2008 11:53 pm

Re: Financial topics

Post by Marshall Kane »

For those interested here's latest from Roubini: http://www.ft.com/cms/s/0/90227fdc-900d ... abdc0.html

The risk of a double-dip recession is rising
By Nouriel Roubini
Published: August 23 2009 18:55 | Last updated: August 23 2009 18:55

T he global economy is starting to bottom out from the worst recession and financial crisis since the Great Depression. In the fourth quarter of 2008 and first quarter of 2009 the rate at which most advanced economies were contracting was similar to the gross domestic product free-fall in the early stage of the Depression. Then, late last year, policymakers who had been behind the curve finally started to use most of the weapons in their arsenal.

That effort worked and the free-fall of economic activity eased. There are three open questions now on the outlook. When will the global recession be over? What will be the shape of the economic recovery? Are there risks of a relapse?

On the first question it looks like the global economy will bottom out in the second half of 2009. In many advanced economies (the US, UK, Spain, Italy and other eurozone members) and some emerging market economies (mostly in Europe) the recession will not be formally over before the end of the year, as green shoots are still mixed with weeds. In some other advanced economies (Australia, Germany, France and Japan) and most emerging markets (China, India, Brazil and other parts of Asia and Latin America) the recovery has already started.

On the second issue the debate is between those – most of the economic consensus – who expect a V-shaped recovery with a rapid return to growth and those – like myself – who believe it will be U-shaped, anaemic and below trend for at least a couple of years, after a couple of quarters of rapid growth driven by the restocking of inventories and a recovery of production from near Depression levels.

There are several arguments for a weak U-shaped recovery. Employment is still falling sharply in the US and elsewhere – in advanced economies, unemployment will be above 10 per cent by 2010. This is bad news for demand and bank losses, but also for workers’ skills, a key factor behind long-term labour productivity growth.

Second, this is a crisis of solvency, not just liquidity, but true deleveraging has not begun yet because the losses of financial institutions have been socialised and put on government balance sheets. This limits the ability of banks to lend, households to spend and companies to invest.

Third, in countries running current account deficits, consumers need to cut spending and save much more, yet debt-burdened consumers face a wealth shock from falling home prices and stock markets and shrinking incomes and employment.

Fourth, the financial system – despite the policy support – is still severely damaged. Most of the shadow banking system has disappeared, and traditional banks are saddled with trillions of dollars in expected losses on loans and securities while still being seriously undercapitalised.

Fifth, weak profitability – owing to high debts and default risks, low growth and persistent deflationary pressures on corporate margins – will constrain companies’ willingness to produce, hire workers and invest.

Sixth, the releveraging of the public sector through its build-up of large fiscal deficits risks crowding out a recovery in private sector spending. The effects of the policy stimulus, moreover, will fizzle out by early next year, requiring greater private demand to support continued growth.

Seventh, the reduction of global imbalances implies that the current account deficits of profligate economies, such as the US, will narrow the surpluses of countries that over-save (China and other emerging markets, Germany and Japan). But if domestic demand does not grow fast enough in surplus countries, this will lead to a weaker recovery in global growth.

There are also now two reasons why there is a rising risk of a double-dip W-shaped recession. For a start, there are risks associated with exit strategies from the massive monetary and fiscal easing: policymakers are damned if they do and damned if they don’t. If they take large fiscal deficits seriously and raise taxes, cut spending and mop up excess liquidity soon, they would undermine recovery and tip the economy back into stag-deflation (recession and deflation).

But if they maintain large budget deficits, bond market vigilantes will punish policymakers. Then, inflationary expectations will increase, long-term government bond yields would rise and borrowing rates will go up sharply, leading to stagflation.

Another reason to fear a double-dip recession is that oil, energy and food prices are now rising faster than economic fundamentals warrant, and could be driven higher by excessive liquidity chasing assets and by speculative demand. Last year, oil at $145 a barrel was a tipping point for the global economy, as it created negative terms of trade and a disposable income shock for oil importing economies. The global economy could not withstand another contractionary shock if similar speculation drives oil rapidly towards $100 a barrel.

In summary, the recovery is likely to be anaemic and below trend in advanced economies and there is a big risk of a double-dip recession.

The writer is professor of economics at the Stern School of Business, NYU

Copyright The Financial Times Limited 2009. You may share using our article tools. Please don't cut articles from FT.com and redistribute by email or post to the web.
Post Reply

Who is online

Users browsing this forum: No registered users and 1 guest