Financial topics
Re: Financial topics
One more time the story is woven. 1929-1932 Hoover did nothing. That is far from fact. Hoover did everything but overthrow the Constitution of the US, which was the first thing FDR and the Congress did on March 9, 1933 (Presidential inaugeration was March 3 or March 4 back then). Bush will be criticized for doing nothing again. But, look at all the stuff that has been pulled here. The WSJ article John posted said Charles Schwab had more cash than cap value. There is nothing in that article that the cash belongs to Charles Schwab, just that it is in the company. I am actually astounded they would use such an example. The other misinformation in this article is that the PE of the market has averaged 16 over history. That is probably 40% to 50% higher than historic average. One thing for sure, never has dividends this low ever been accepted in the market prior to this bubble and we are up from levels that would prove to any generation before that valulations were a fiction. This is such a huge bubble in everything and has gone on so long that it has been accepted as normal and all writing relates to the abnormal being normal.
Re: Financial topics
John, was this a joke? Do you really believe that short term market movements are based on P/E ratios? The market has already factored in bad earnings (in case you did not notice the recent 40% decline). True, it has not yet factored in a decade of bad earnings, but I'd say more than one quarter is pretty much in the bagJohn wrote:How on earth could that possibly happen, when P/E ratios are in the 20s, andHiggenbotham wrote:My best guess is that you are correct this time and stocks will rally for a few days, or maybe even a few weeks or months.
corporate earnings are still falling????
John
Furthermore, treasuries are actually a pretty good indicator of future market direction. They soared just before stocks began tanking and have gone higher though most of the decline. This abruptly reversed last week, treasuries were falling hard, along with commodities, further supporting the idea that stocks are likely to rally. We may have one more big test of the lows early this week, probably Monday, but my guess is that will be the short term bottom. We are very likely to see the DOW hit 10,000 again (or just below as this psychologically important level is approached) over the next 2 months. It would not even surprise me to see PANIC BUYING. By the way, insider buying, which is yet another somewhat reliable indicator, has been stronger than ever in October (which is a big contrast, selling was overwhelming a year ago as the market was peaking) - these guys often lead the market by a few weeks.
Last edited by Gordo on Sun Oct 12, 2008 10:15 pm, edited 1 time in total.
Re: Financial topics
Schwab has over $1 trillion dollars in customer funds. I don't think they are counting that as corporate cash.mannfm11 wrote:The WSJ article John posted said Charles Schwab had more cash than cap value. There is nothing in that article that the cash belongs to Charles Schwab, just that it is in the company. I am actually astounded they would use such an example. .
I agree that the article was poorly written, but I think they were talking about the Graham-Shiller P/E previously mentioned in the article. In their defense, standard P/E is not a very useful figure and has little if any value to an investor. Normalized P/E ratios such as the Graham-Shiller calculation mentioned, or even better, the price to peak earnings figure Dr. Hussman (of Hussman funds) uses, are MUCH more important and useful for investing purposes.mannfm11 wrote:The other misinformation in this article is that the PE of the market has averaged 16 over history. That is probably 40% to 50% higher than historic average.
Last edited by Gordo on Sun Oct 12, 2008 10:16 pm, edited 1 time in total.
Plunge Protection Team
A question from a web site reader:
Washington Post story.
http://www.washingtonpost.com/wp-srv/bu ... plunge.htm
The real name of the group is the "Working Group on Financial
Markets," and it's in the Treasury Dept. The working group
languished for several years, but was reactivated late in 2006 by
Treasury Secretary Hank Paulson.
http://www.telegraph.co.uk/money/main.j ... view30.xml
Today, we still have a Plunge Protection Team -- but it consists of
Hank Paulson himself, along with Ben Bernanke. The two of them form
the "Plunge Protection Duo," and they run around proposing bailout
plans to Congress.
Sincerely,
John
The Plunge Protection Team is the whimsical name used in a 1997> I was wondering if the "Plunge Protection Team" might have had
> something to do with the volatility Friday. If so, were they
> trying to counter the drop - with effort?
Washington Post story.
http://www.washingtonpost.com/wp-srv/bu ... plunge.htm
The real name of the group is the "Working Group on Financial
Markets," and it's in the Treasury Dept. The working group
languished for several years, but was reactivated late in 2006 by
Treasury Secretary Hank Paulson.
http://www.telegraph.co.uk/money/main.j ... view30.xml
Today, we still have a Plunge Protection Team -- but it consists of
Hank Paulson himself, along with Ben Bernanke. The two of them form
the "Plunge Protection Duo," and they run around proposing bailout
plans to Congress.
Sincerely,
John
P/E Ratio
Dear Gordo,
increased early this year, but they had been flat for years. Now
they're clearly falling sharply, and to say that one day's "key
reversal" being enough to change that enormous amount of momentum
seems very unrealistic to me.
that I don't use it for investment purposes. I use it to apply the
Law of Mean Reversion, and for that purpose it doesn't matter what
version of P/E is used, as long as the same one is used consistently.
The real crime that's committed by pundits and analysts is to say
"Using forward earnings, P/E is 16, which is below average." It's
unbelievable that someone could actually earn money as an analyst and
say something as incredibly stupid as this.
First, P/E using so-called "forward earnings" is a crock anyway,
since no one knows for sure what next year's earnings will be, and so
you have to use analysts' estimates, which are always bloated.
And second, 16 is the historical average for P/E10. The historical
average for P/E(forward) is probably something like 8 (just a guess).
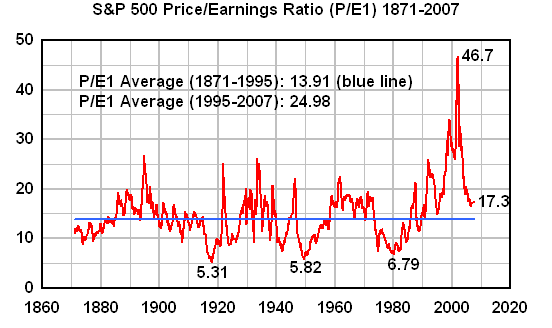
In my opinion, anyone who looks at the above graph and still thinks
that the market is going up (in a period of falling corporate
earnings) must be cross-eyed.
Incidentally, this graph is from August, 2007. One of these days,
I'll have to bring it up to date.
Sincerely,
John
John J. Xenakis
E-mail: john@GenerationalDynamics.com
Web site: http://www.GenerationalDynamics.com
Forum: http://www.GenerationalDynamics.com/forum
I'm taking downward momentum into account. It's true that P/EsGordo wrote: > John, was this a joke? Do you really believe that short term
> market movements are based on P/E ratios? The market has already
> factored in bad earnings (in case you did not notice the recent
> 40% decline). True, it has not yet factored in a decade of bad
> earnings, but I'd say more than one quarter is pretty much in the
> bag
increased early this year, but they had been flat for years. Now
they're clearly falling sharply, and to say that one day's "key
reversal" being enough to change that enormous amount of momentum
seems very unrealistic to me.
You've criticized my use of the P/E index before, but keep in mindGordo wrote: > I agree that the article was poorly written, but I think they
> MIGHT have been talking about the Graham-Shiller P/E previously
> mentioned in the article? Not sure. But in their defense, standard
> P/E is not a very useful figure and has little if any value to an
> investor. Normalized P/E ratios such as the Graham-Shiller
> calculation mentioned, or the price to peak earnings figure Dr.
> Hussman (of Hussman funds) uses, are MUCH more important and
> useful for investing purposes.
that I don't use it for investment purposes. I use it to apply the
Law of Mean Reversion, and for that purpose it doesn't matter what
version of P/E is used, as long as the same one is used consistently.
The real crime that's committed by pundits and analysts is to say
"Using forward earnings, P/E is 16, which is below average." It's
unbelievable that someone could actually earn money as an analyst and
say something as incredibly stupid as this.
First, P/E using so-called "forward earnings" is a crock anyway,
since no one knows for sure what next year's earnings will be, and so
you have to use analysts' estimates, which are always bloated.
And second, 16 is the historical average for P/E10. The historical
average for P/E(forward) is probably something like 8 (just a guess).
In my opinion, anyone who looks at the above graph and still thinks
that the market is going up (in a period of falling corporate
earnings) must be cross-eyed.
Incidentally, this graph is from August, 2007. One of these days,
I'll have to bring it up to date.
Sincerely,
John
John J. Xenakis
E-mail: john@GenerationalDynamics.com
Web site: http://www.GenerationalDynamics.com
Forum: http://www.GenerationalDynamics.com/forum
Latest third quarter corporate earnings growth estimates
** Latest third quarter corporate earnings growth estimates
CNBC Earnings Central just posted the latest estimate of third
quarter earnings growth. As usual, the estimate has fallen sharply
from a week earlier.
Date 3Q Earnings growth estimate as of that date
------- -------------------------------------------
Mar 3: 25.0%
Apr 1: 17.3% Start of previous (2nd) quarter
Jul 1: 12.6% Start of quarter
Sep 5: 0.8%
Sep 12: -1.6%
Sep 19: -0.3%
Sep 26: -1.7% End of quarter
Oct 3: -4.8%
Oct 10: -7.8%
John
Re: P/E Ratio
P/E1 can mean revert lower while stocks rise. It can also rise dramatically even as stocks decline. That's why I think there is almost no value in P/E1 and I do not use it for any purpose. P/PE (PE=Peak Earnings) is much more useful for predicting long term trends (complete market cycles which often go for decades). ALL of these measurements are useless for short term prediction (less than 1 year) which seems to be how you want to use P/E. The market does not work like that.John wrote: You've criticized my use of the P/E index before, but keep in mind
that I don't use it for investment purposes. I use it to apply the
Law of Mean Reversion, and for that purpose it doesn't matter what
version of P/E is used, as long as the same one is used consistently.
As earnings head toward zero, P/E1 heads toward INFINITY. We could at some point see very high P/E1 ratio while at the same time many companies had more cash on hand than their stock valuation. That would be a dream come true for a value investor with funds to invest.
Re: Financial topics
http://gordosoft.com/vviz/TonyTaleOfTwoCharts.jpg
A tale of two charts, from a friend of mine, Tony.
A tale of two charts, from a friend of mine, Tony.
Re: Financial topics
John,
I came across your website a couple days ago and have been reading it with interest. My background is engineering, so I understand your logrithmic charts, best fit line, etc. I'm no expert in finance/stocks, though.
I have two questions:
1. Do you think the recent talk of injecting money into the banks will stall another downward spiral, at least for the short term?
2. Is Japan severly undervalued? Your chart (on your link "How to compute the 'real value' of the stock market") appears to show the Nikkei 225 "real value" around 50,000, based on your straight line of the exponential curve, but it's currently at 8,000.
Joe
Re: P/E10 drops below average for the first time since 1995
I was amused to read the last paragraph in the referenced article. Here are the key sentences:John wrote:** P/E10 drops below average for the first time since 1995
According to an article in the Wall Street Journal, P/E10 has dropped
below average for the first time since 1995.
http://online.wsj.com/article/SB122368241652024977.html
John
Normally, I can expect John to react with a nice tirade when some public media person uses the word "capitulation". I wonder if John is feeling a bit of stupor?WSJ, Zwieg wrote: This collective stupor may very likely be the last stage before many investors finally let go -- the phase of market psychology that veteran traders call "capitulation." Stupor prevents rash action, keeping many long-term investors from bailing out near the bottom. When, however, it breaks and many investors finally do let go, the market will finally be ready to rise again. No one can spot capitulation before it sets in. But it may not be far off now.
Who is online
Users browsing this forum: No registered users and 6 guests