** 20-May-2021 World View: P/E ratio, M2V, birth rate, and CPI
richard5za wrote: Thu May 20, 2021 8:35 am
> My take on the stock market based upon about 150 years of history
> is that fair value is a P/E of 18 in good times and 13 in
> difficult economic times. But the PE is currently well over 30 on
> S&P 500. History shows it always overshoots when it corrects, in
> some cases to a PE of 5 or 6. So the maths says the minimum it
> will come off is 50%. But as PE of 5 gives it a fall of 85%. Not
> over a few weeks but over a couple of years even 3 or 4 years
> What I don't know is when the fall will start or the nature of the
> initial trigger.
> The real question is identifying the assets to be invested in when
> the fall starts. US dollar, gold miners, cash in your trading
> account?
This bifurcation of the p/e ratio index into good vs difficult
economic times is very interesting. Since you've studied the history,
perhaps you could explain further what you mean by good vs economic
times, since that isn't always obvious, and how the p/e ratio relates
to them.
I'm looking at this whole issue from a slightly different angle. We
know that there was a "baby boom" after World War II, among people who
had postponed having children until after the war. The mood at that
time was that Americans were extremely afraid of WW III with the
Communists, but after America and the West had defeated the Great
Depression, the Nazis, and Imperial Japan, Americans felt confident
enough in the future of the country and the economy that people felt
that it was OK to bring children into the world.
So I'm looking at the mirror image of the Baby Boom. If an increased
birth rate was the major statistical indicator after the war, then
what were the statistical indicators before the war that led
eventually to the baby boom? These are of interest, because the same
statistica indicators should be evident today.
Higgie has mentioned the decline in birth rates. In fact, the decline
is so large that it's hard to overstate.
> "U.S. birth and fertility rates in 2020 dropped to
> another record low as births fell for the sixth consecutive year
> to the lowest levels since 1979, according to new data from the
> Centers for Disease Control and Prevention's National Center for
> Health Statistics.
> The number of births in the U.S. declined last year by 4% from
> 2019, double the average annual rate of decline of 2% since 2014,
> the CDC said in preliminary birth data released Wednesday. Total
> fertility rates and general fertility rates also declined by 4%
> since 2019, reaching record lows. The U.S. birth rate is so low,
> the nation is "below replacement levels," meaning more people die
> every day than are being born, the CDC said."
>
https://www.cnbc.com/2021/05/05/us-birt ... -says.html
So we can make the opposite observation to the one about the Baby
Boom: Americans today don't feel confident enough in the future of the
country and the economy for it to be OK to bring children into the
world.
The velocity of money is poorly understood by the so-called "expert"
economists, but it's another quantity that measures the confidence of
Americans in the future of the country and the economy. It crashed
significantly in the last year, matching the crash in the birth rate.
https://fred.stlouisfed.org/series/M2V
The velocity of money measures the number of times that a single
dollar bill is used to purchase goods and services produced
domestically within a year. If the velocity of money is falling, it
means that people are losing confidence in the economy, and are afraid
to spend. If it's increasing, then people are confident about the
economy.
This is related to the inflation rate (CPI, or Consumer Price Index).
If the velocity of money is high, then people are buying more and more
goods, and the CPI will increase. If it's low, then people are saving
money instead of spending it, and the CPI will remain steady, or fall
in the extreme.
So if you look at the graph of M2V in the above link for the St Louis
Fed, you'll see that the "steady state" of M2V is around 1.8, which
means that a single dollar bill is used on an average of 1.8 times
to buy something in a given year.
In the 1970s, M2V surged to 1.9 and the CPI surged to 12%. The surge
peaked in 1981, and then began to fall back to the "steady state"
value during the 1980s. During the 1980s, the CPI also began to
return to "normal."
There was a big M2V surge in the 1990s, during the halcyon days of the
Clinton administration, reaching 2.2 in 1997. Why was there no big
increase in CPI? That's good question, and suggests that there may be
a factor of "lessons learned" from the 1970s. This is something that
requires more research.
During the period 2003-2006, M2V surged again. The year 2003 was the
first year of the Fourth Turning Crisis Era, and it was the time when
the Gen-X financial engineers cam to power and created fraudulent
synthetic subprime mortgage backed securities and sold to the
generation of their fathers, whom they hated.
However, M2V began falling sharply in 2008 with the financial
crisis. By 2014 this trend was quite clear, and I wrote
a fairly lengthy article on it:
** 13-Jan-14 World View -- Plummeting velocity of money explains deflation trend
** http://www.generationaldynamics.com/pg/ ... tm#e140113
This is the graph that I included with that article:
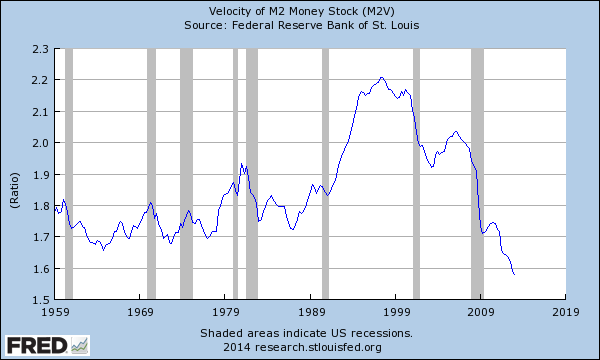
- Velocity of Money (M2V), 1959-2013 (St. Louis Fed)
So it was clear in 2014 that the velocity of money had been falling
sharply since the financial crisis. By 2013, it had fallen to 1.5
from its "steady state" of 1.8. This indicates how Americans were
losing confidence in the economy. And this was also the time when the
birth rate began falling. By this time, any significant increase in
the CPI really was mathematically impossible, given the falling values
of velocity and birth rate. So M2V, CPI and birth rate have a lot in
common.
Another reason why the birth rate is related to the CPI is that one of
the major reasons that people spend money on consumer goods is because
of their children -- diapers, bigger houses, etc. So a birth rate
decline signals a stable CPI and a fall in M2V.
If you look at the current version of the M2V graph, you'll see that
M2V continued falling since 2013, and then began crashing
significantly starting in Q1 2020, at the start of the Wuhan
Coronavirus Pandemic. This was also the time when the birth rate
decline turned into a birth rate crash.
So I'm bemused by the present day hysteria over inflation. As anyone
with half a brain can see, any major surge in inflation is almost
mathematically impossible. If people are so afraid of what's coming
that they won't have children, then they won't have any need to spend
more money than usual, so the CPI will remain steady.
All of this should be obvious to the "experts" and "economists"
on CNBC, Bloomberg, FBN, and elsewhere. But these people are
idiots. As I pointed out in the past, they have no clue
why there was a bubble in the late 1990s, why it crashed in 2000,
why there was a real estate bubble, and so forth. These people
never get anything right, except by chance.
However, the indicators that I've been discussing are quite startling.
The birth rate collapsed in the last year, and M2V has collapsed in
the last year. The CPI spiked in April, though not as much as in
September 2008, which was followed by a year of deflation. So we'll
see what happens in the coming months.
What I've written above is still somewhat tentative, and requires more
research. Serious, thoughtful contributions are welcome.
Getting back to your original observation, Richard, the P/E ratio is
astronomically high today, as it was prior to the 1929 panic. Do you
see any further relationships with the indicators I've been
discussing?