Page 366 of 366

Re: Higgenbotham's Dark Age Hovel

Posted: Sat Nov 21, 2026 9:16 am
by aedens
Term structures.
Will add into march sweeps with some modest svix on peak wasting.
Not different this time and the polo-tics are a proverbial level two and three disaster of the wasting.

Re: Higgenbotham's Dark Age Hovel

Posted: Sat Nov 21, 2026 11:16 am
by Higgenbotham
The summary of John's 2019 post below is at this point he would be looking for the Dow to fall to under 3,000 from the all time high of 54,700 reached this year, a 95 percent drop at the least.
John wrote: Sat Nov 16, 2019 1:15 pm ** 16-Nov-2019 World View:

Stock Market Bubble and Correction


Here's my DJIA history page:

** DJIA Historical Page
** http://www.generationaldynamics.com/pg/ ... i.djia.htm


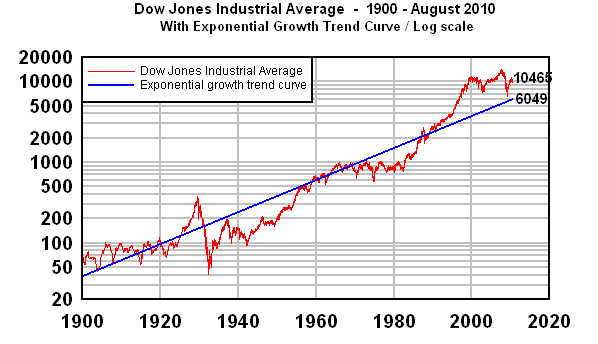
The DJIA is currently around 300% of its historic trend value.

It's been above trend value almost continually since 1989, after
recovering from the false panic of 1987.

It's been above 200% of trend value almost continually since
the "irrational exuberance" of 1996. Even the Nasdaq crash
in 2000 barely dented it.

The financial crash of 2008 did dent it a bit, bringing it down to
about 130% of trend value. However, by 2013 it was back above 200% of
trend value by 2013.

It's been around 300% above trend value almost constantly since
January 2018.

This bubble is so huge and has lasted so long, that there are few
people in the world (outside of the Generational Dynamics web site)
who have a clue what's going on.

If the DJIA were simply to return to its trend value (from 300% to
100%), there would be a 67% correction.

However, that's not what's going to happen. The Law of Reversion of
the Mean says that in return for the 20 years when the DJIA has been
above trend value, it must be below the trend value, long enough and
deep enough to balance out the 20 years above. And if it overshoots,
as it almost certainly will, then the result will be even lower.

In 1928-33, the DJIA fell 90%. That seems likely to be repeated.

The following graph, which hasn't been updated since 2010, illustrates
all of the above:
Image
  • DJIA -- 1900-August 2010 - with exponential growth trend
    curve - Log scale


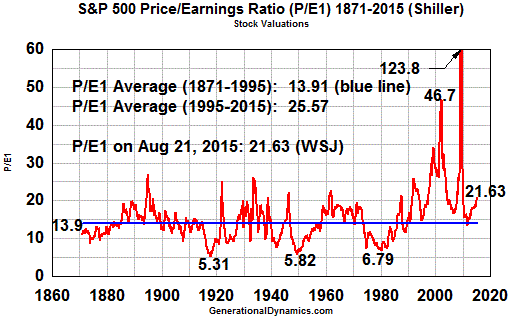
The S&P 500 Price/Earnings ratio is currently around 20, far above its
historical average of 14. Once again, The Law of Reversion of the
Mean applies.

I haven't updated the following chart since 2015, but it shows the
situation:
Image

The blue line shows the historic average, around 13.9. The P/E ratio
has been above the historic average, sometimes way above, since the
1990s. By the Law of Mean Reversion, it will have to fall an
equivalent amount below the historic average to maintain the long-term
average. It fell to the 5-6 range three times in the last century, in
1917, in 1949, and in 1980. That's going to happen again with
absolute certainty, and that means that the Dow Jones Industrial
Average will fall below 3000, from its current level of 26000.

Once again, this implies implies a 90% correction.
A reasonable question would be whether John would be adjusting the 3,000 number as the trendline rises or E rises. He didn’t between the year 2004 or so when I first read it and 2019 when I last read it. He was always consistent with 3,000 or below, no matter how much the bubble grew. How much below was possible according to his analysis I don't recall him ever saying. I do recall him saying that the longer it stays above trend, the longer or deeper it will need to stay below trend.

"The Law of Reversion of the Mean says that in return for the 20 years when the DJIA has been above trend value, it must be below the trend value, long enough and deep enough to balance out the 20 years above."

Re: Higgenbotham's Dark Age Hovel

Posted: Sat Nov 21, 2026 3:09 pm
by Higgenbotham
Looking at long term growth rates over the past 2000 years, population has grown 30 fold and wealth 600 fold, according to AI's best estimate of wealth now and 2000 years ago. This would put the average growth rate of wealth over the past 2000 years at 0.3 percent per year.

What did one of the Market Wizards say about a penny at the the time of Christ?

In Jack D. Schwager’s Market Wizards, trader Ed Seykota suggested computing the value of one penny invested at the time of Christ and compounded at 3% per year, then considering why nobody has anywhere near that amount today. [1, 2]

Key Points from Seykota's Thought Experiment

The Compounding Paradox: Over roughly 2,026 years, a single cent ($0.01) compounded annually at 3% grows to approximately $1.02 × 10²⁴ (over a septillion dollars).

Why Nobody Has It: In real-world history, uninterrupted compounding at that scale does not happen because wars, collapses, confiscation, and currency debasement interrupt wealth preservation. [1]

Gold and Debasement: Seykota noted that inflation sweeps away old orders, currencies get debased, and gold gets dug up, refined, and buried again—trending toward centralized vaults rather than endless individual compounding. [1]

You can read more about his profile and quotes on 7 Circles or view a copy of Market Wizards via ValuePlays.