Page 948 of 2985
Re: Financial topics
Posted: Sun Oct 20, 2013 1:09 pm
by at99sy
vincecate wrote:aedens wrote:I asked that question today in public. Apparently media outlets have been trying to find anyone who has successfully signed up, and have failed to do so.
My guess is only those with a pre-existing condition are signing up.
When Obamacare was first announced one of my friends who needs two knee replacements and neck and back surgery as well as shoulder work due to professional skiing for 25 years said. "it will be great, I'll be able to get all this work finally done for free." She had no answer when I asked who was going to pay the bills. It was not worth explaining it.
sy
Re: Financial topics
Posted: Sun Oct 20, 2013 2:56 pm
by Higgenbotham
Browsing through here and putting the dates on his diagram of the 13 year cycle:
http://www.cycle-trader.com/pentagonal.htm
October 04, 1974 Bear market low
October 19, 1987 Crash low
October 18, 2000 First major low after the all time high
October 18, 2013 Yesterday's all time high
He may be onto something as noted yesterday.
http://www.cycle-trader.com/
"Mr. Cowan's 2013+ forecast listed 3 dates as critical in 2013, Mid-May, Mid-August, and October. The indices have made triple tops on these dates!"
The first 2 lows in 1974 and 1987 are well known, but many (including me) are probably unaware that a fairly signficant low occurred on October 18, 2000:
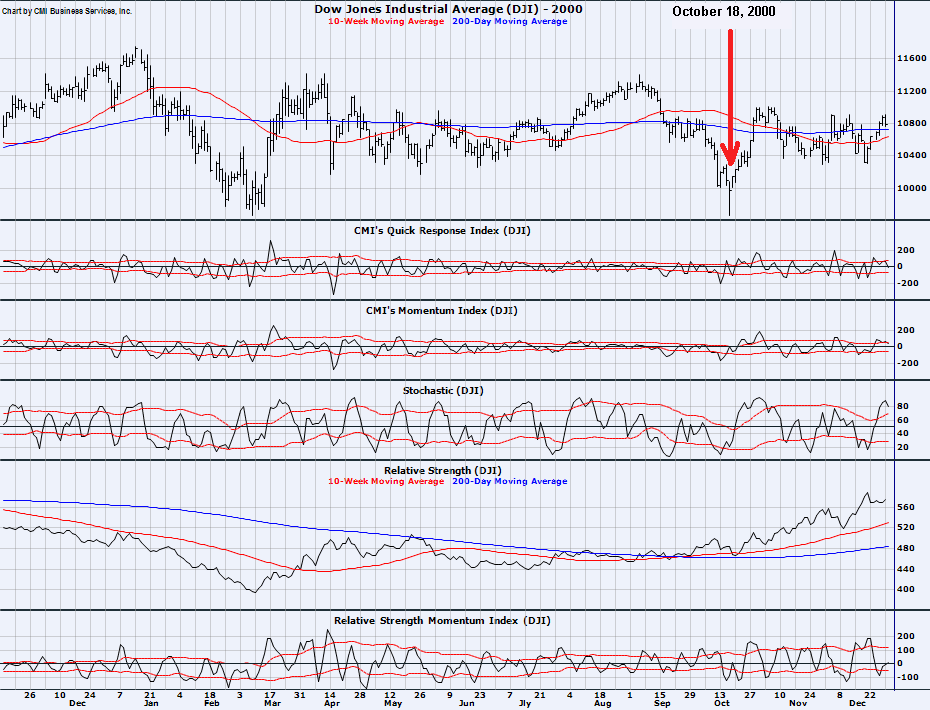
- DJI_2000.gif (58.34 KiB) Viewed 4113 times
Re: Financial topics
Posted: Sun Oct 20, 2013 3:02 pm
by John
You really shouldn't have deleted that post that referenced the ftense.com
article. That's a really good article.
 http://www.ftense.com/2013/10/how-qe-wi ... s-are.html
Re: Financial topics
Posted: Sun Oct 20, 2013 4:12 pm
by Higgenbotham
There's one last cycle that points to the possibility that Friday or thereabouts could have been the end of the stock market bubble. It has to do with the "mirroring" effect that is seen between (downcrash) panic lows and the subsequent upcrash panic highs that occur at the tops of bubbles.
The first panic low occurred on October 10, 2008 and the low of the panic was March 6, 2009. I'll just call this 5 months less 4 days.
The first panic high occurred on May 22, 2013. 5 months less 4 days from that day is October 18, 2013.
The obvious question is: Did this work at the 2002/2003 bottom versus the 2007 top? It did to some degree but not as cleanly as the present case, provided the present case really turns out to work this cleanly.
I have a theory as to why these undershoots and overshoots are happening. For example, someone could ask why the stock market didn't bottom during the October 2008 panic as it normally would, say, in 1987. The answer to that might be that the Fed overstimulated in the period leading up to 2007, so it took an extra wave down to work all that off. Likewise, since the undershoot was so huge, the Fed had to overstimulate even more to get the market back up and that extreme dose of stimulation caused Cowan's May 21, 2013 target to be hit but then exceeded in some of the averages on the mirror 5 months later.
Re: Financial topics
Posted: Sun Oct 20, 2013 8:59 pm
by aedens
Re: Financial topics
Posted: Sun Oct 20, 2013 9:26 pm
by aedens
Re: Financial topics
Posted: Sun Oct 20, 2013 9:54 pm
by Higgenbotham
Mirroring Diagram
The first set also breaks down into 3 month double tops and bottoms.

- MIRRORING.gif (28.37 KiB) Viewed 4062 times
Re: Financial topics
Posted: Sun Oct 20, 2013 10:16 pm
by aedens
Multiple procedures and no consequences. As forwarded kuznet cycles as not to confuse the local tribal connotations of the silent war fish heads that are real. I have noted some venn diagram overlays as noted before composite overlays. Not going short today since discipline and conviction is another list item. No clue other than the animal spirits and the lack of civility on levels of self indulgances on the animal farm.
Re: Financial topics
Posted: Sun Oct 20, 2013 10:40 pm
by Higgenbotham
The mirroring diagrams broken down to the weekly level give a better view. Also shows the cascading nature of the undershoot and overshoots which began in 2006, versus the 2002/2003 bottoming process which was fairly stable.
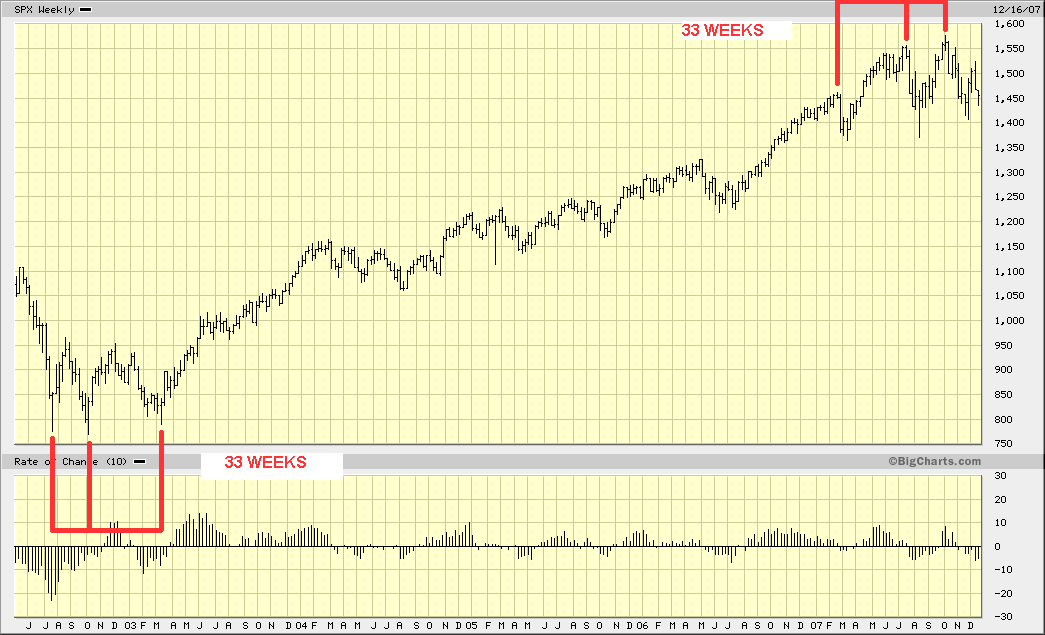
- MIRRORING1.gif (43.61 KiB) Viewed 4052 times

- MIRRORING2.gif (44.77 KiB) Viewed 4052 times
Re: Financial topics
Posted: Mon Oct 21, 2013 4:16 pm
by aedens
Raising cash from Juniors in relationship to WTI slide and the incessant analyst bashing and placing underbids.
Basically basket sorting and TA. I was 28% cash and also noted no slip in metals.
I will guess with out checking today's sells a three to one bias to sell into this. The junkies
are yellened into a ratt myopic lethargy we seen coming into this over pricing since life is at the margins.
Rotation appears to be leaking to the Dow 30.
Back testing some idea constructs for the upcoming it puts the lotion on market
http://finance.yahoo.com/news/3-safe-et ... 07691.html
I will recheck some Wendsday program bids.
http://finviz.com/futures.ashx If the product is so good why is it backed up with a gun to your head guys.
Broken windows to broken skulls will lead to what is always does as it is walked to the dust bin of history.
https://www.youtube.com/watch?v=GvNu54qoi0M
https://www.youtube.com/watch?v=N-rap0WhqSU
http://finance.yahoo.com/blogs/breakout ... 26137.html
No one is running to cover yet
http://www.zerohedge.com/news/2013-10-2 ... -out-there mr. market has a eye brow raised to the searing process ensueing.